
A "Comparison" block puts one of your saved comparisons directly into an estimate report. It renders the comparison as a cross-project table — every record you are comparing side by side, with their design fields, cost fields and total cost — so the report can show how this estimate sits against the projects you benchmarked it on, without the reader leaving the document.
To add a "Comparison" block to an estimate report follow these steps.
Navigate to the desired estimate and select the "Report" tab, then open the report you want to edit.
Press "Add Block" at the top of the "Report Structure" panel on the right.
Scroll down the block list to the "COMPARISONS" heading. Every comparison saved in your company is listed here by name. NOTE, press the magnifying glass beside the "COMPARISONS" heading to search by name if the list is long.
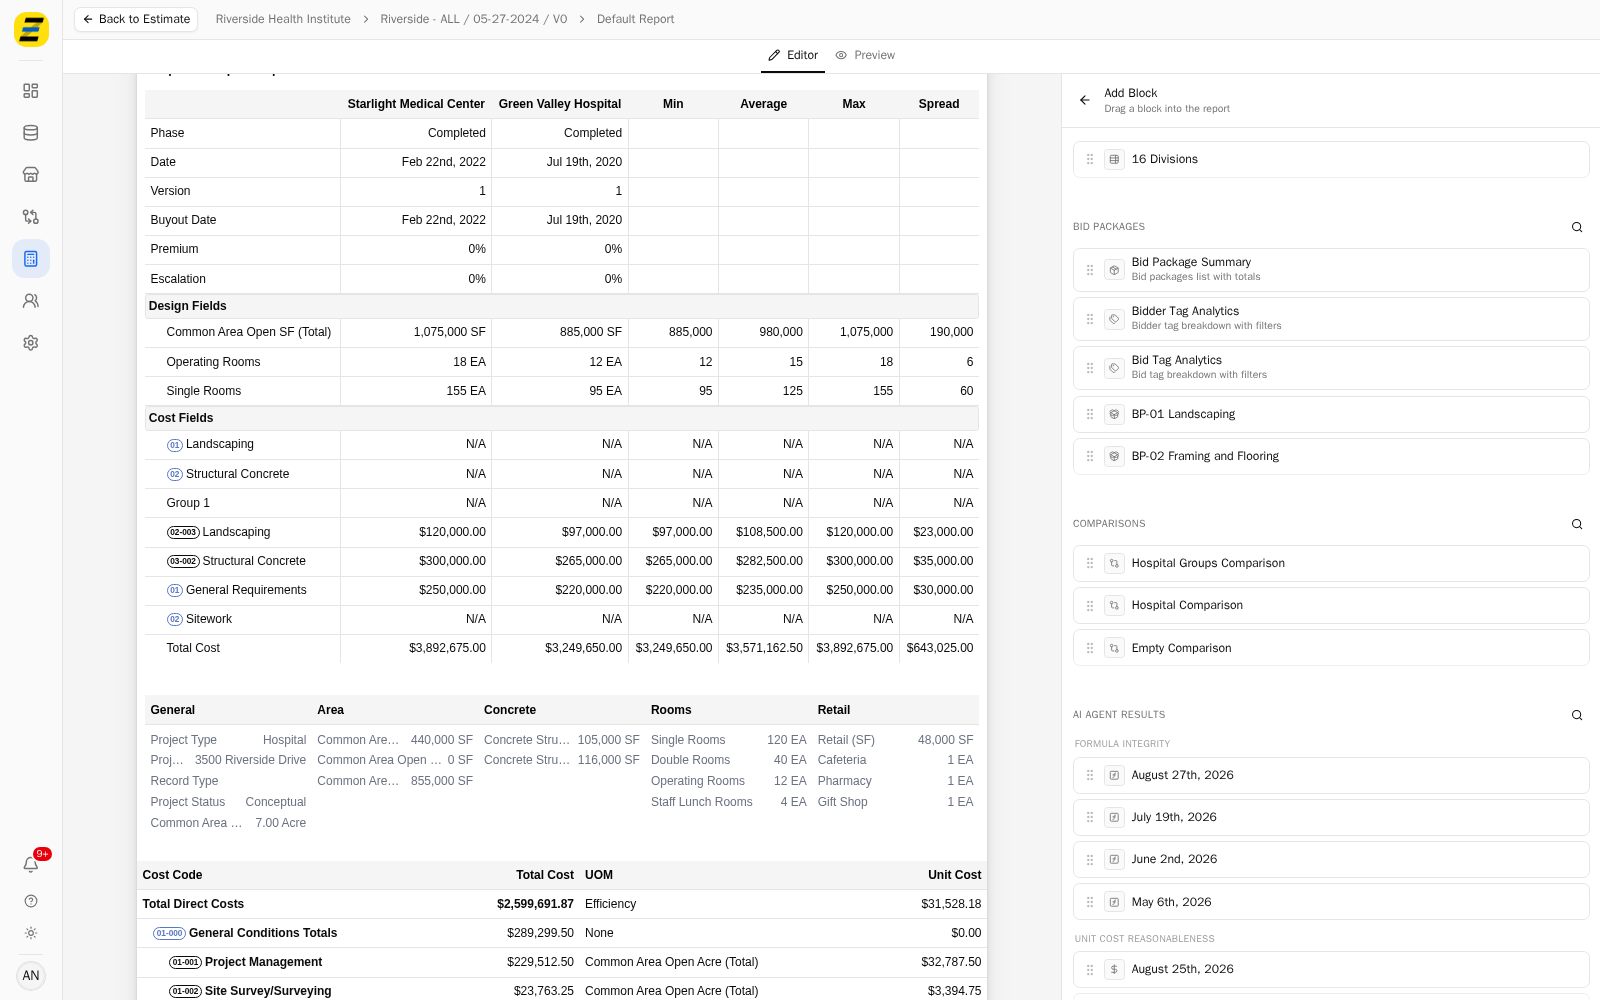
Drag the comparison you want from the list into the report, and drop it on the line where you want it to sit. The panel reads "Drag a block into the report" — comparisons are added by dragging, not by clicking.
The block arrives already tied to that comparison and takes its name, so there is no separate step to choose one. Press the block in the "Report Structure" panel to open its settings.
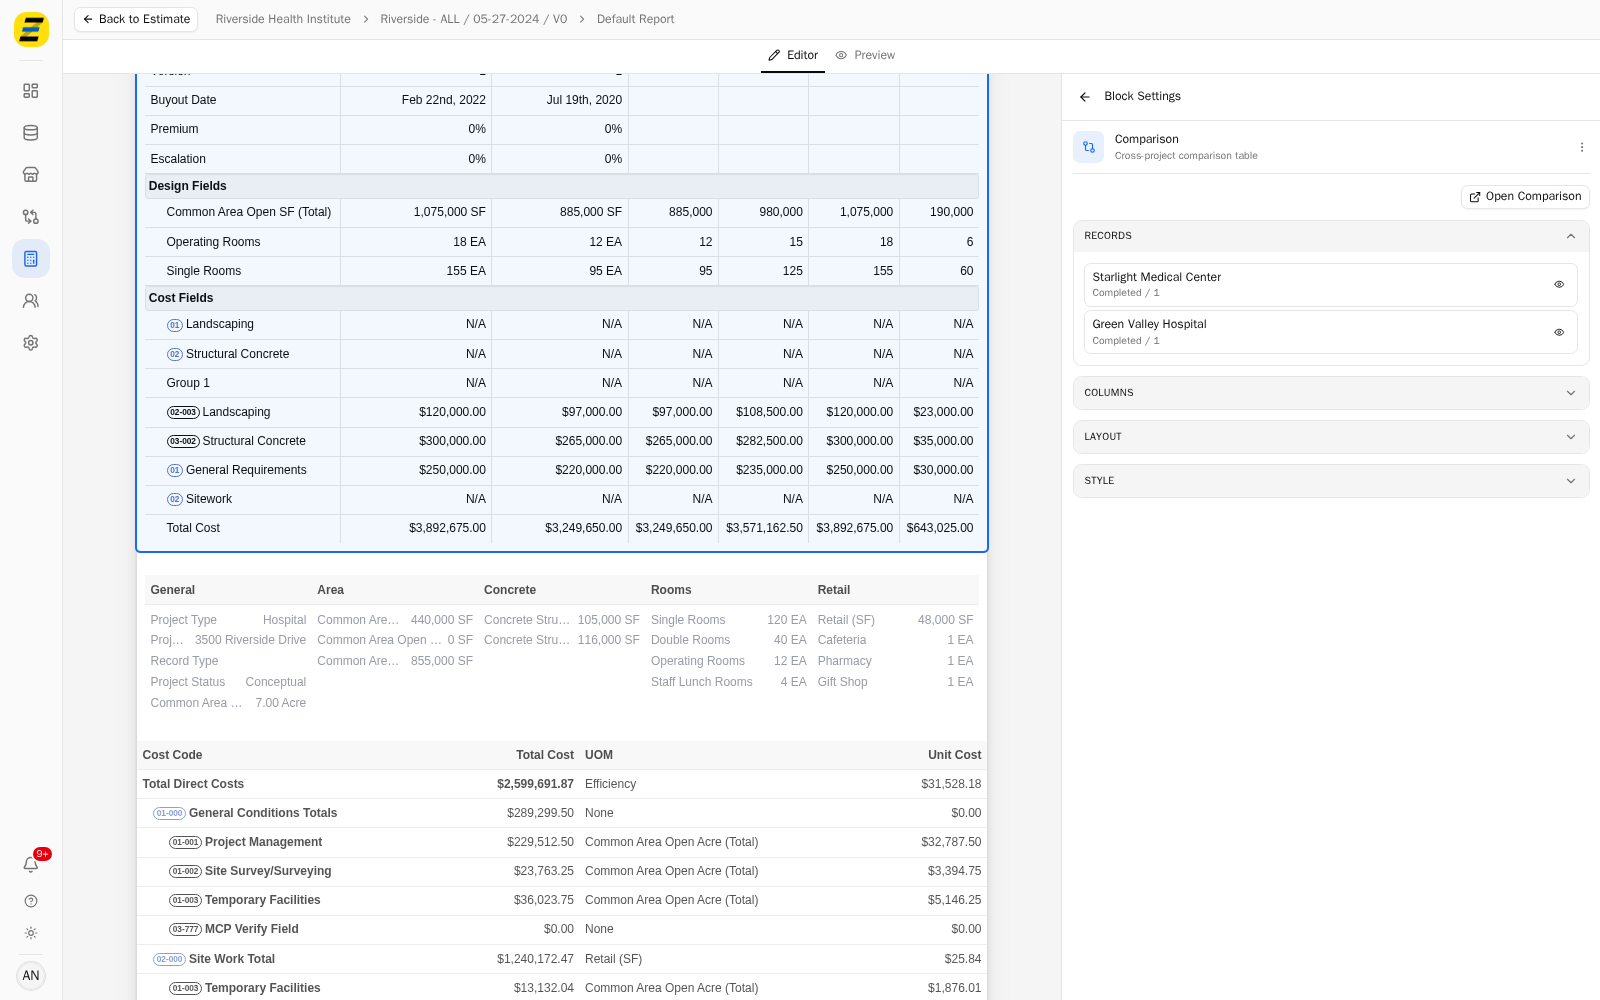
Press "Open Comparison" at the top of the settings panel at any time to open the underlying comparison in a new tab. This is the place to change which records or fields the comparison itself contains — the block shows the comparison, it does not define it.
Open the "RECORDS" section to choose which of the compared projects appear. Every record in the comparison is listed with the eye icon beside it; press the eye to hide one from this block. NOTE, hiding a record here only affects this block. The comparison itself is unchanged, so the same comparison can appear twice in one report showing different records.
Open the "COLUMNS" section to choose which statistical columns sit to the right of the records — "Min", "Average", "Median", "Max", "Spread" and "Variance". Switch on the ones you want. NOTE, "Variance" is only available when the comparison is a variance comparison, meaning it has a "From" and a "To" record selected. On any other comparison it is greyed out and labelled "Only available for variance comparisons".
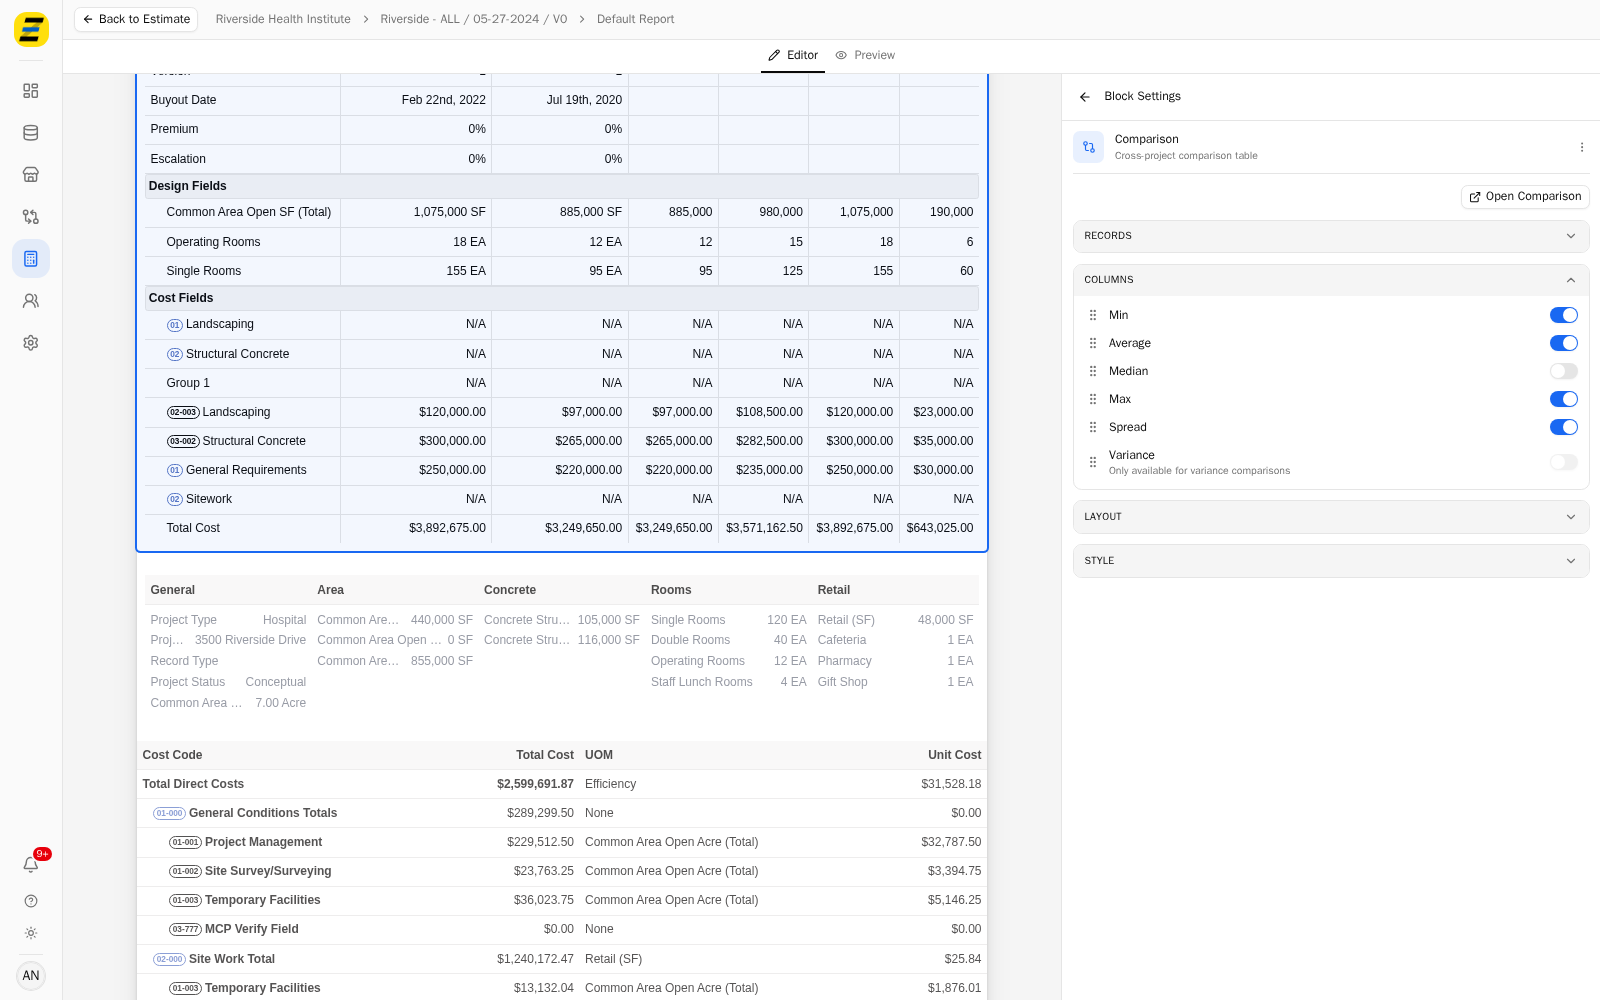
Drag the columns by the handle on their left to change the order they appear in the table.
Open the "LAYOUT" section to set the "Padding" inside the block, the "Margin Bottom" beneath it, and "Page Break After" if this block should be the last thing on its page.
Open the "STYLE" section to set "Stripe Rows", "Header Text Color", "Header Background Color", "Header Font Weight", "Font Size", "Indent Size" for the nested cost rows, and the "Border Bottom" width and "Border Color".
The preview on the left updates as you go, so you can see the finished table while you set it up.
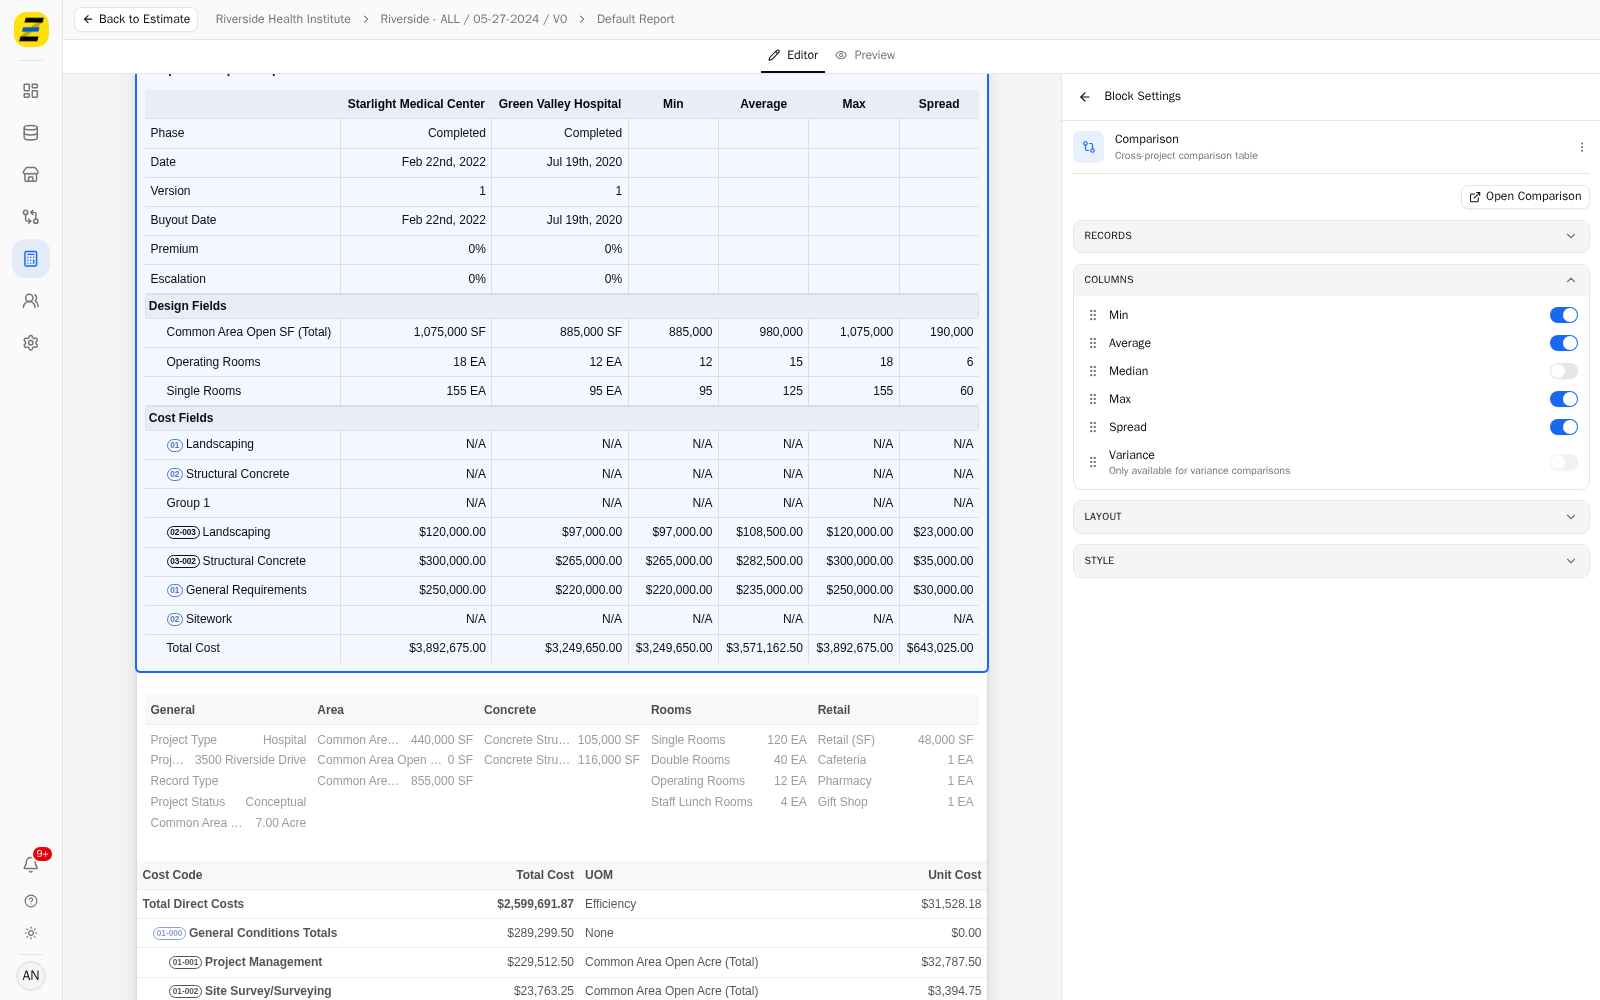
We recommend turning on only the statistical columns that support the point the report is making. A comparison table with all six columns and several records becomes wide quickly, and the "Spread" column — the gap between the lowest and highest — is usually the one that tells the reader the most on its own.