
"Design Data Visualization" puts your estimate's design figures next to the same figures from each of its comps, and works out the range across those comps for you. It is how you check whether what you have programmed is in line with the jobs you are comparing against.
To compare your design data against your comps follow these steps.
Navigate to the desired estimate and select the "Analytics" tab.
Select "Design Data Visualization" from the list down the left.
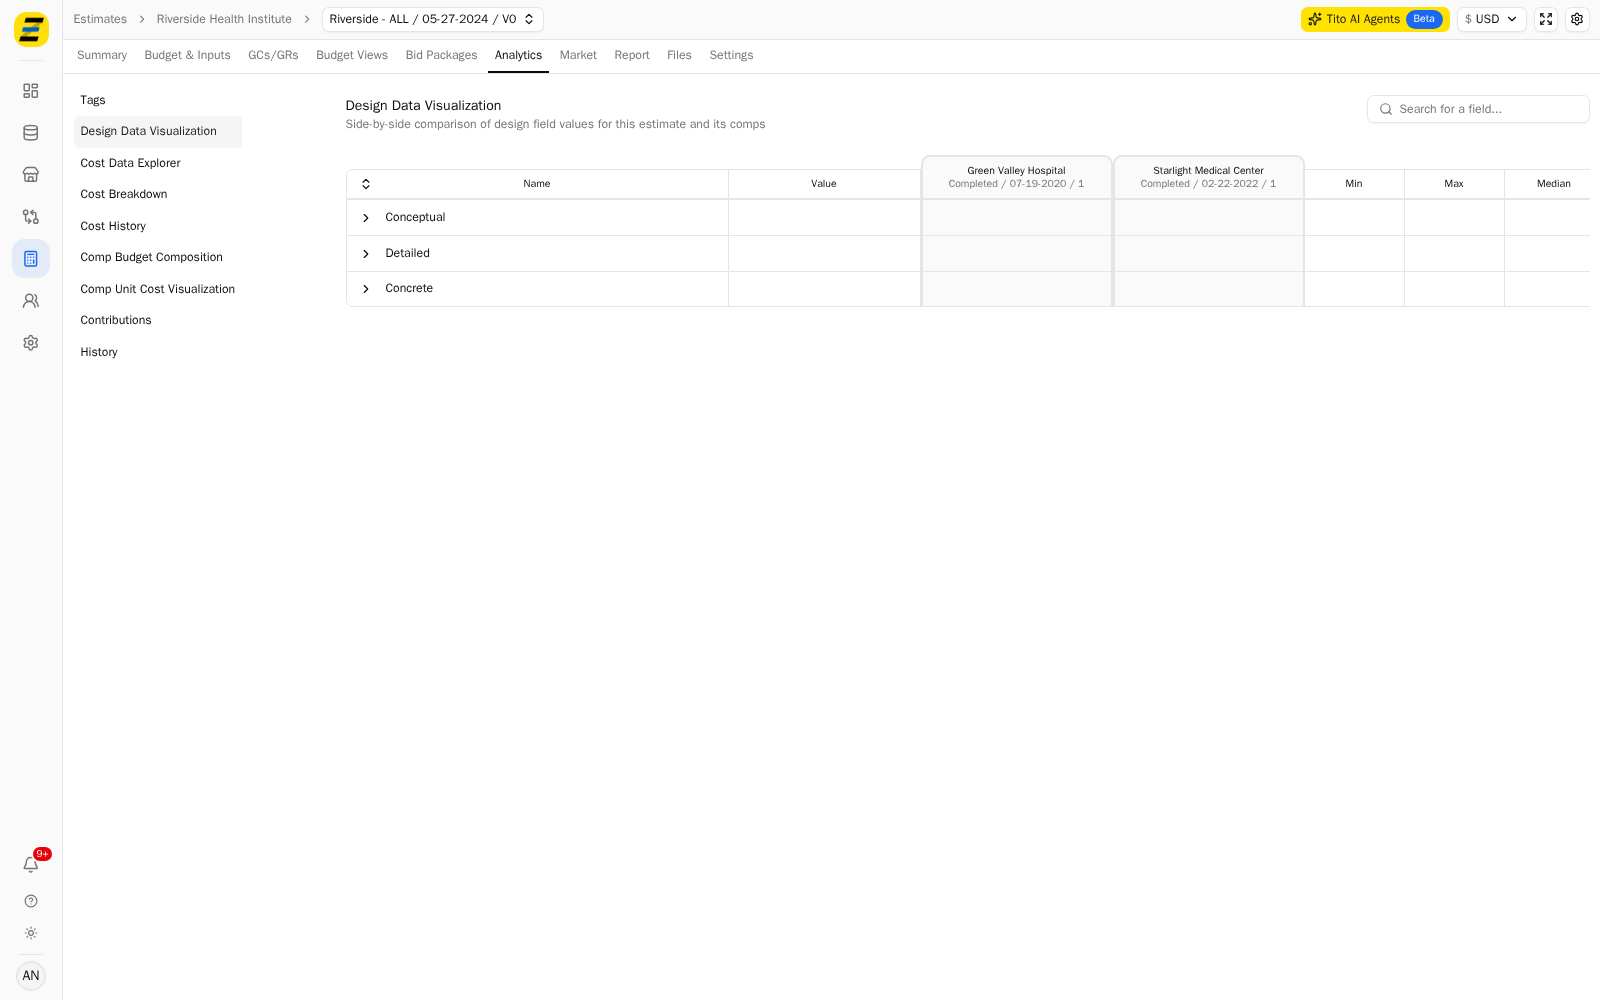
The table shows one row per design field, grouped the same way as your inputs — a section such as "Conceptual" or "Detailed", then a group such as "Rooms" or "Retail". Press a group to open it.
Read across the row.
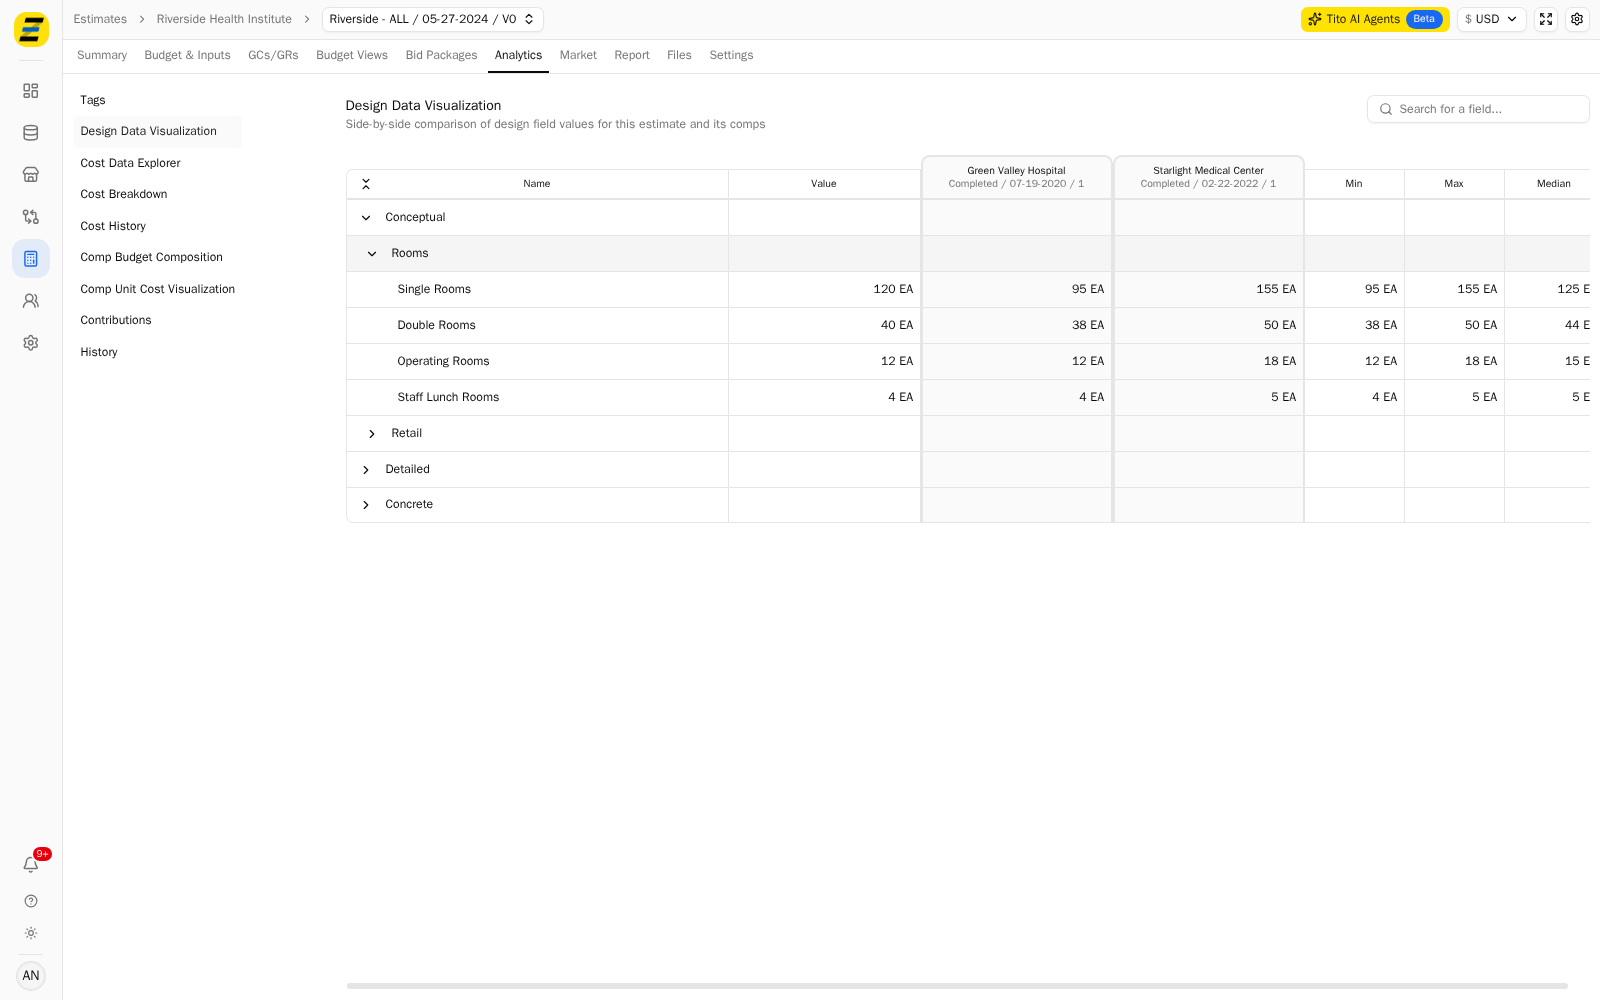
"Value" is your estimate's figure.
Then one column per comp, headed with the comp's name and record, showing that comp's figure for the same field.
"Min", "Max" and "Median" summarise the comps.
Use the range to sanity check your own number. In the example this estimate carries 120 "Single Rooms" against comps of 95 and 155, so it sits inside the range rather than at either end.
Use the "Search for a field..." box in the upper right corner to jump to a single field rather than opening each group.
Scroll the table sideways to reach further comps if the estimate has more than fit on screen.
Please note that "Min", "Max" and "Median" are worked out from the comps only — your own "Value" is not counted in them. In the example the "Median" for "Single Rooms" is 125 EA, halfway between the two comps at 95 and 155, and not affected by this estimate's 120. That is what makes the three columns a benchmark to compare yourself against rather than a summary you are already part of.